For specific problems. On a common platform.

First, get to know the operation, the result and the conditions of the introduction. You only need to contact us when you want to apply it to your own environment.

Solutions by operational area

Energy

Energy monitoring and sub-metering

Track site and sub-meter data, trends, deviations and savings.

How does it work? →
Energy

Energy community operation

Measurement points, participants, sharing and accounting processes.

Detailed overview →
Operation

Device and maintenance management

Device status, fault alerts, planned and event-driven maintenance.

The operating process →
Terrain

Mobile field enforcement

Tasks, walkthroughs, checkpoints, photos and offline work.

Field skills →
City

Smart city device monitoring

Distributed infrastructure, map state and event management.

Urban use →
Water

Water and network loss analysis

Examination of zones, water balance, consumption patterns and disorders.

Water overview →
Business

Customer and project processes

Customers, contracts, projects, billing and financial relationships.

Business connections →
Energy monitoring and sub-metering

Intervention decision from consumption data.

The solution collects and organizes energy data into an organizational, site, building or submeter context. It not only shows how much weight has been lost, but also where it is worth looking into the discrepancy.

InputElectricity, water, gas and temperature meters; M‑Bus, Modbus or other controlled data source
ResultTrend, comparison, base consumption, deviation, alarm and backmeasure
First introductionDesignated sites and measurement points with data quality control
MeasurementNormalizationComparisonDeviationActionBack measurement
Energy community

Measurement, participants and billing and allocation logic in one process.

Community production and consumption can be managed transparently if the measurement points, participant rights, sharing rules and billing and allocation periods are linked to the same data model.

It's the system's job

  • assignment of participants and measurement points;
  • processing of production and consumption data;
  • management of sharing and aggregation rules;
  • verifiable periodic calculation;
  • preparation of report and billing relationships.

The exact billing and allocation and regulation operation is always determined by the given construction and contractual model.

Tool and maintenance

The event should not stop on the dashboard.

Technical data is related to device and location. Based on a verified rule, a deviation can trigger a notification, error ticket or maintenance task.

Typical process

  1. The device status or measurement value is different.
  2. The platform identifies the affected device and location.
  3. An alarm or task is generated for the person in charge.
  4. Field implementation documents the measure.
  5. Status sorting and closing are traceable.
Mobile field operation

The work continues even where there is no stable network.

The field user sees his own task, location and control points. The execution can be documented with a photo, measurement, comment and time stamp.

TaskAllocation, priority, location and deadline
ExecutionChecklist, QR/NFC, photo, measurement and comment
Without connectionOffline data recording and subsequent controlled synchronization
GIS, BIM and spatial hierarchy

Same tool in map, building and business process.

GIS shows the spatial relationships of sites, networks and outdoor infrastructure. BIM can add technical context within the building. Both relate to the same location and device registry.

Possible views

  • locations and devices on a map;
  • network sections, zones and events;
  • building-level-room hierarchy;
  • status data linked to a technical model;
  • navigation from device to task or document.

BIM functions are a function of the available model and project configuration.

Smart city and water

Distributed infrastructure in a common operational picture.

The condition of city and public utilities can really be interpreted spatially. The platform supports the connection of zones, devices, telemetry, events and field interventions.

CityPublic lighting, institutional energy, urban devices and events
WaterDMA zones, water balance, minimum night consumption and disorders
TerrainOn-site inspection, error recording and action feedback
Business relations

A physical event can also have business consequences.

On the OrigSmart platform, the device, location and measurement data can be linked to a customer, contract, project or billing and allocation process. Thus, less manual transfer between technical and administrative systems is required.

Connection examples

  • measurement point → customer or participant;
  • device error → ticket or work task;
  • project → location, means and cost;
  • measurement period → billing and allocation input;
  • report → management or sustainability decision.
Processes in practice

From planning to controlled decisions.

Project tasks and approvals are not isolated records: they remain traceable parts of daily operations.
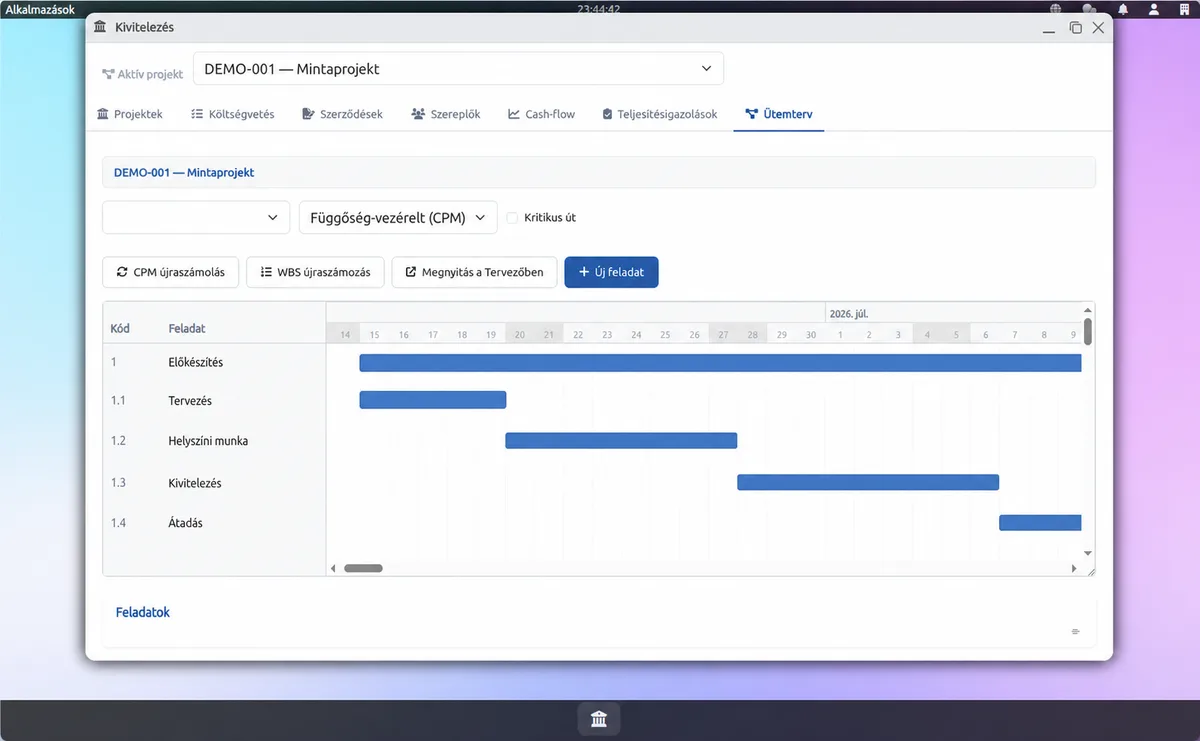
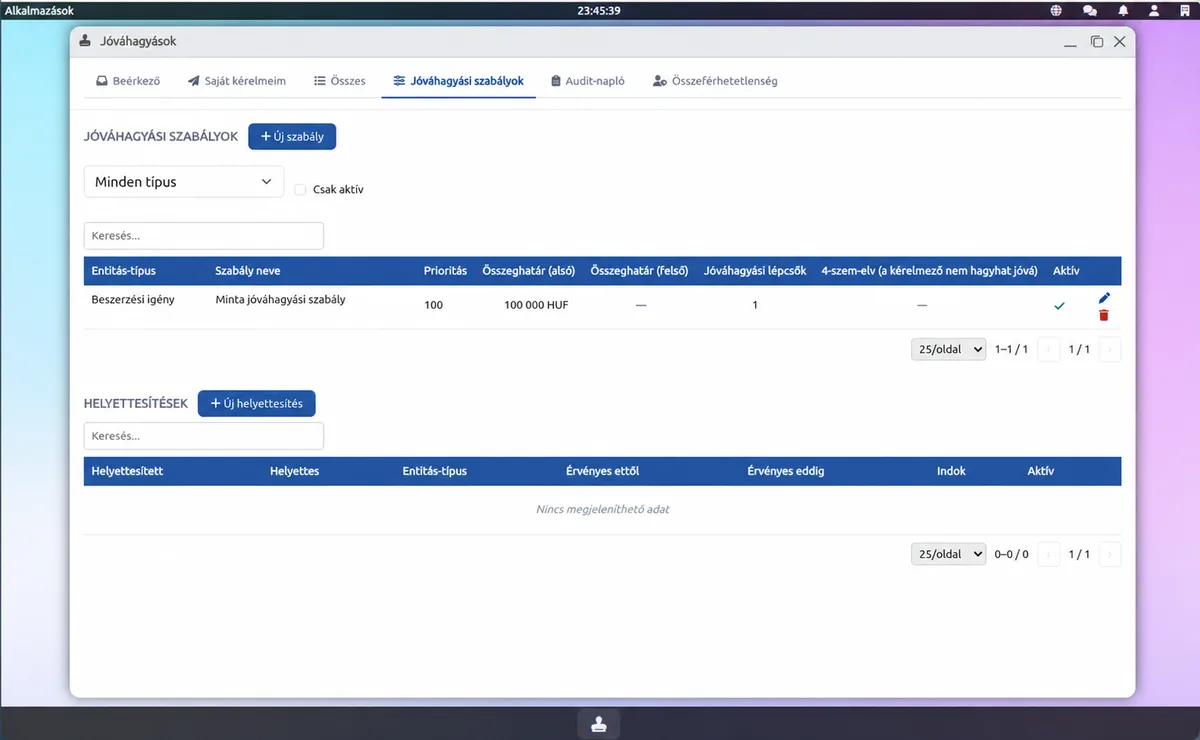
Project and delivery scheduling

Project and delivery scheduling

Tasks, dependencies and deadlines in a shared project view.

Controlled approval

Controlled approval

Limits, stages and substitutions in an auditable process.

Open image in full size
If you already have the relevant area

The next step can be a technical summary, a pilot sketch or a personal consultation.

It is not necessary to request an offer immediately. The hardware platform, industry applications and evidence can be read further.