Energy monitoring and sub-metering
Track site and sub-meter data, trends, deviations and savings.
How does it work? →First, get to know the operation, the result and the conditions of the introduction. You only need to contact us when you want to apply it to your own environment.
Track site and sub-meter data, trends, deviations and savings.
How does it work? →Measurement points, participants, sharing and accounting processes.
Detailed overview →Device status, fault alerts, planned and event-driven maintenance.
The operating process →Tasks, walkthroughs, checkpoints, photos and offline work.
Field skills →Map display of devices, networks, zones and events.
Spatial operation →Linking building model, location hierarchy and technical data.
GIS and BIM together →Distributed infrastructure, map state and event management.
Urban use →Examination of zones, water balance, consumption patterns and disorders.
Water overview →Customers, contracts, projects, billing and financial relationships.
Business connections →The solution collects and organizes energy data into an organizational, site, building or submeter context. It not only shows how much energy was consumed, but also where it is worth looking into the discrepancy.
Community production and consumption can be managed transparently if the measurement points, participant rights, sharing rules and billing and allocation periods are linked to the same data model.
The exact billing and cost allocation, regulation operation is always determined by the given construction and contractual model.
Technical data is related to device and location. Based on a verified rule, a deviation can trigger a notification, fault ticket or maintenance task.
The field user sees his own task, location and control points. The execution can be documented with a photo, measurement, comment and time stamp.
GIS shows the spatial relationships of sites, networks and outdoor infrastructure. BIM can add technical context within the building. Both relate to the same location and device registry.
BIM functions are a function of the available model and project configuration.
The condition of city and public utilities can really be interpreted spatially. The platform supports the connection of zones, devices, telemetry, events and field interventions.
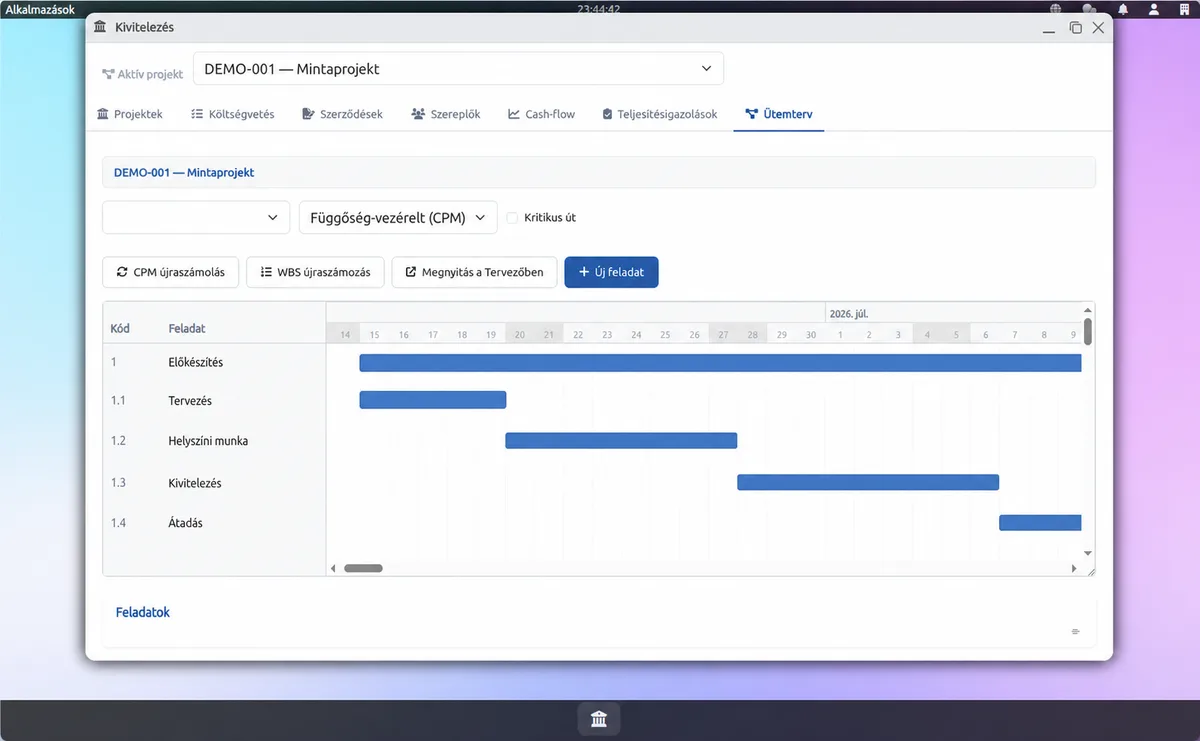
On the OrigSmart platform, the device, location and measurement data can be linked to a customer, contract, project or billing and allocation process. Thus, less manual transfer between technical and administrative systems is required.
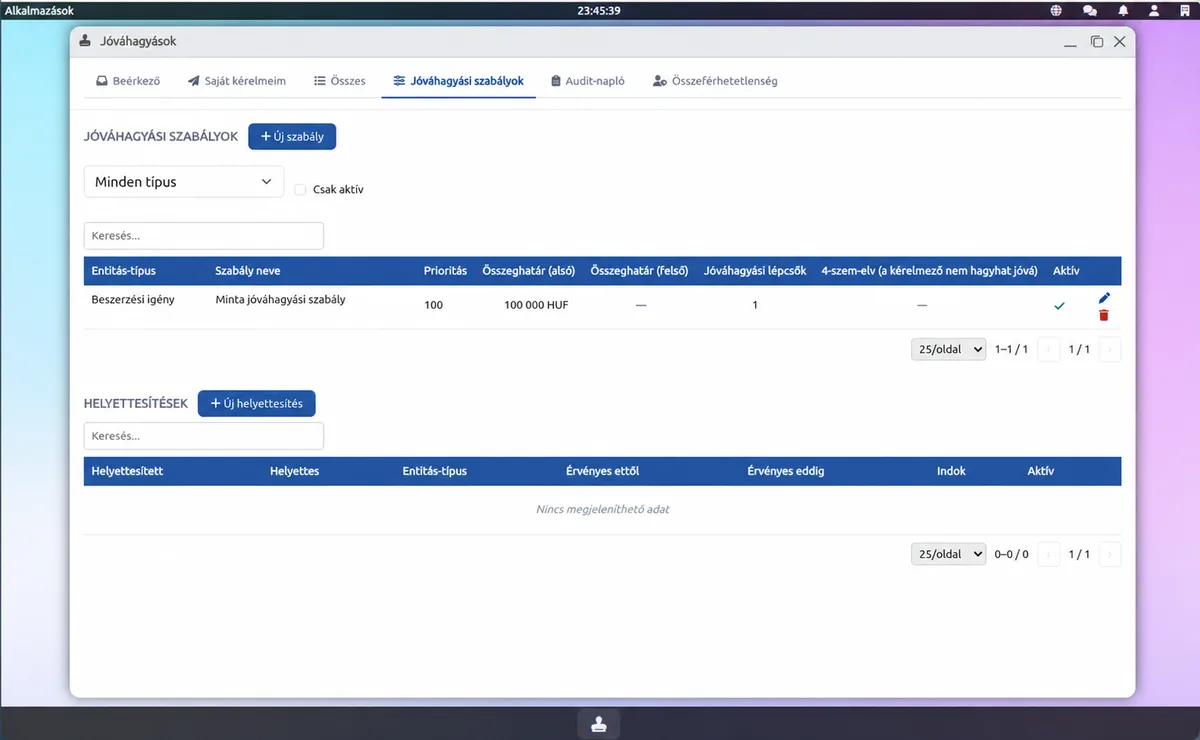
Project tasks and approvals are not isolated records: they remain traceable parts of daily operations.