Different data quality of DMA or supply zones
Zone balance and trend-based deviation indication
Common operational picture of distributed networks, consumption zones, faults and field interventions.
Zone balance and trend-based deviation indication
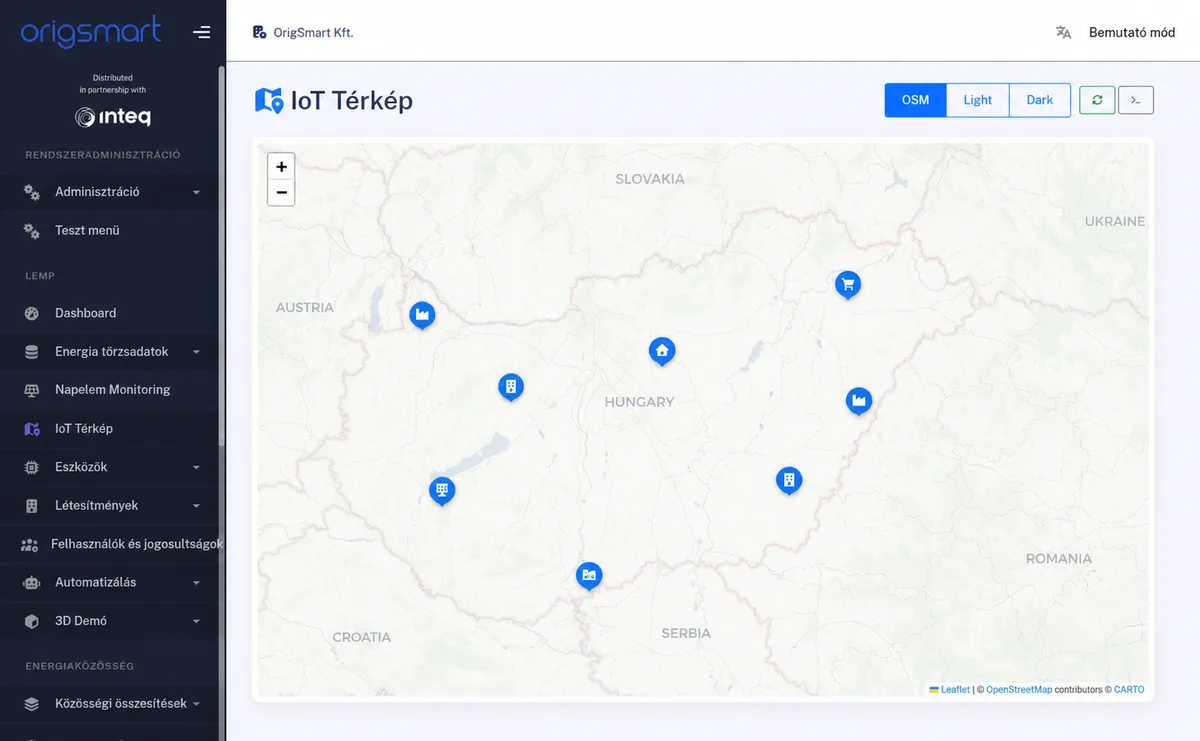
Meters, network points and events on a map
Task responsible for alarm and documented closure
Public utility digitization is not just a remote reading project. The network, measurement zones, consumption time series, work and errors provide a usable picture when they are connected to the same location and device model. In this way, the discrepancy does not remain a graph: it can be followed by an investigation task, an on-site inspection and a documented closure.
In an illustrative DMA zone, the daily supply is 1,200 m³, the sum of certified consumer meters is 930 m³. A difference of 270 m³ is not automatically a leak: it may include measurement time difference, public use, measurement inaccuracy and real network loss. The task of the platform is to provide a uniform time window, data quality indication and investigation trail to separate them.
The example is not an offer, a promise of savings or a general compliance requirement; the final technical solution is determined by the on-site and process survey.
An operating decision should only be based on data of known quality. Missing, estimated or time-lapsed values must be marked, and it is advisable to follow the changes in the points used for the scale in versions. The map display alone is not enough: the person responsible for the alarm, the deadline and proof of closure make the process controllable.
The pilot begins with zone designation and measurement time synchronization testing. We check that input and output meters can be compared in the same time window, and we mark the communication gap, estimate, and physically improbable value separately. We then guide you through an investigation process, from the detection of the discrepancy through the map location and field work order to closure. Success is not necessarily an immediately found pipe break. It is already a value if the measurement error, the uninvoiced legitimate use and the loss requiring further network testing are numerically separated.
In the first phase, the following two areas will be controlled: entrance and exit meters of zone boundaries, pressure and level data and wells, pumping stations, reservoirs and mechanical energy consumption. Connecting all sites, devices and historical data at the same time is not the goal. First, we verify that a reliable decision and a work process that can be closed are made from the selected data. To finalize the scope, two questions are particularly important: Where are the measurement zones that can be reliably closed? How is the field result fed back into the network story? The answers determine the device count, integration task, local data storage, roles, and acceptance test.
Locations, data sources, responsible persons and success criteria.
Controlled connection of designated measurement points and systems.
Dashboard, alert and at least one actionable workflow.
Result, list of deficiencies and quantifiable expansion proposal.
During a short technical consultation, we select the measurement or operating point at which the value of the pilot can be checked.
Pilot consultation