Fragmented measurement data and manual reports
Automatic measurement data collection and validation
Savings that can be verified from measurement data, portfolio-level overview and accountable results.
Automatic measurement data collection and validation
Track baseline, target, savings and variance
Report, alarm and task for the same site
Energy monitoring is not a savings project in itself. It will have business value if the consumption can be linked to a site, technology, period and person in charge, and then a controllable measure can be initiated from the deviation. In an ESCO environment, this also includes the base period, corrections and the calculation rule adopted in the contract.
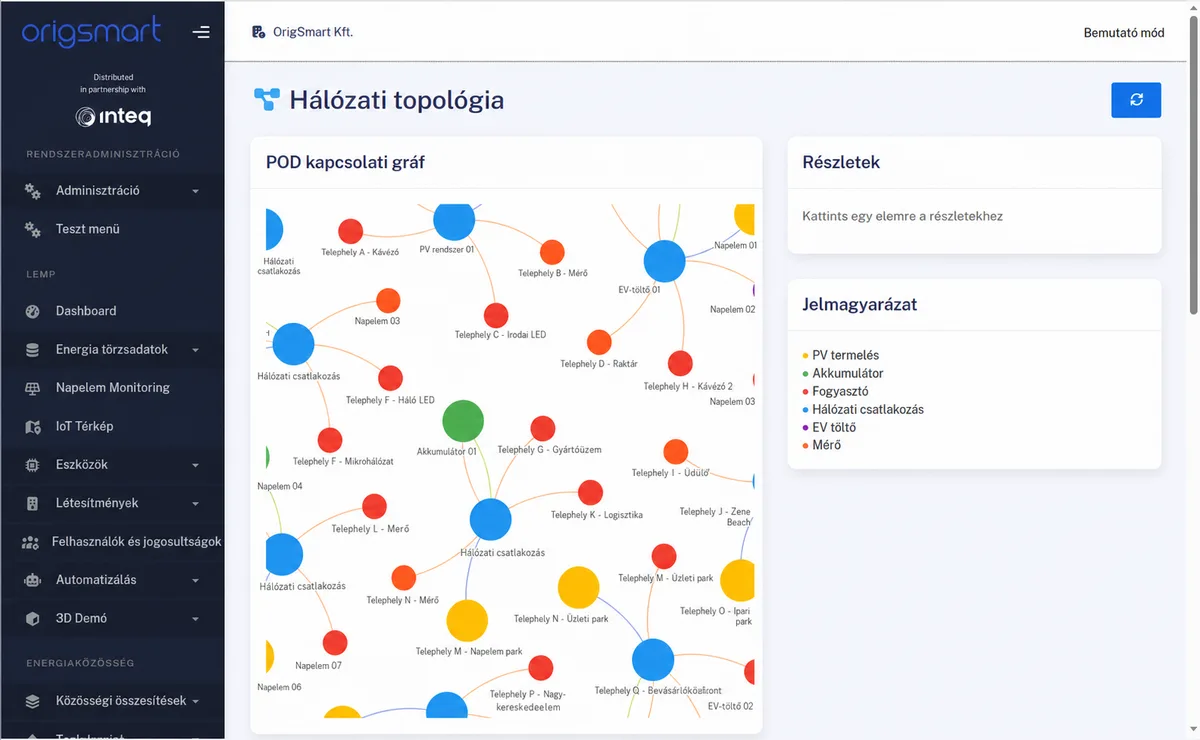
In a three-shift plant, the monthly electricity bill alone does not show that the 18 percent increase was caused by more production or idle consumption. If five technological sub-meters, the shift schedule and the number of units produced are added to the main meter, a specific kWh/unit indicator can be calculated. The purpose of the exemplary pilot is not a percentage promised in advance, but rather to show in which period, for which consumer and for which operational reason the specific value differs.
The example is not an offer, a promise of savings or a general compliance requirement; the final technical solution is determined by the on-site and process survey.
For financial or ESCO accounting, the measurement trail is at least as important as the dashboard. The source of the data, time stamp, unit of measure, the reason for any replacement or correction and the approver must be recorded. The calculation of savings only becomes contractual evidence on the basis of the agreed base and correction model.
The rollout starts with a meter and consumer inventory. For each point, we record the resolution, delay, unit of measure and business owner of the data, and then observe at least one complete operating cycle. In the case of shift production, this means more production days, and in the case of a weather-dependent building, periods of different external temperatures. Acceptance does not depend on the number of incoming data sets: you must receive a reproducible indicator, a documented deviation, a designated person responsible, and a verified measure. If the base or the production context is not stable enough, we record this as a deficit, not cover it with an artificial savings percentage.
In the first phase, the following two areas will be controlled: electricity data from main meters and technological submeters and gas, heat, water and production quantities on a common timeline. Connecting all sites, devices and historical data at the same time is not the goal. First, we verify that a reliable decision and a work process that can be closed are made from the selected data. To finalize the scope, two questions are particularly important: Which consumers can actually be influenced? Which data series can be included in financial or ESCO accounting? The answers determine the device count, integration task, local data storage, roles, and acceptance test.
Locations, data sources, responsible persons and success criteria.
Controlled connection of designated measurement points and systems.
Dashboard, alert and at least one actionable workflow.
Result, list of deficiencies and quantifiable expansion proposal.
During a short technical consultation, we select the measurement or operating point at which the value of the pilot can be checked.
Pilot consultation